Prometheus Quick Start for MySQL Monitoring
This article explains how to use dbbot to quickly deploy a Prometheus + Grafana + Alertmanager stack and connect MySQL plus host exporters.
1. Environment example
| IP Address | HOSTNAME | Deployment Component |
|---|---|---|
| 192.0.2.131 | 192-0-2-131 | MySQL primary node, node_exporter, mysqld_exporter, dbbot |
| 192.0.2.132 | 192-0-2-132 | MySQL replica node, node_exporter, mysqld_exporter |
| 192.0.2.133 | 192-0-2-133 | MySQL replica node, node_exporter, mysqld_exporter |
| 192.0.2.161 | 192-0-2-161 | Prometheus, Grafana, Alertmanager |
2. Preparation
- Complete MySQL deployment first (please refer to MySQL Deployment Quick Start).
- Confirm that the dbbot control node can SSH to the target node.
2.1 Dependency chain
| Item | Details |
|---|---|
| Prerequisites | dbbotctl env setup is complete, the MySQL instances are already running, and both monitoring nodes and MySQL nodes are reachable over SSH |
| Required variables | On the monitoring side, focus on fcs_auto_download plus the alert email settings; on the exporter side, focus on node_exporter_install_type, mysqld_exporter_install_type, and mysqld_exporter_topology |
| Next step | After node_exporter_install.yml / mysqld_exporter_install.yml, register node_exporter / mysqld_exporter with dbbotctl exporter register; if Router metrics are also needed, continue with router_exporter_install.yml |
3. Deploy the Monitoring Stack
3.1 Configure hosts
Edit:
/usr/local/dbbot/monitoring_prometheus_ansible/inventory/hosts.ini
Example:
[prometheus]
192.0.2.161 ansible_user=root ansible_ssh_pass="'<your_password>'"
[grafana]
192.0.2.161 ansible_user=root ansible_ssh_pass="'<your_password>'"
[alertmanager]
192.0.2.161 ansible_user=root ansible_ssh_pass="'<your_password>'"
3.2 Prepare packages or enable auto-download
Put it in the directory: /usr/local/dbbot/monitoring_prometheus_ansible/downloads
prometheus-2.54.0.linux-amd64.tar.gzgrafana-enterprise-10.4.6.linux-amd64.tar.gzalertmanager-0.27.0.linux-amd64.tar.gz
Official download examples:
wget "https://github.com/prometheus/prometheus/releases/download/v2.54.0/prometheus-2.54.0.linux-amd64.tar.gz"
wget "https://dl.grafana.com/enterprise/release/grafana-enterprise-10.4.6.linux-amd64.tar.gz"
wget "https://github.com/prometheus/alertmanager/releases/download/v0.27.0/alertmanager-0.27.0.linux-amd64.tar.gz"
Additional notes:
monitoring_prometheus_ansible/playbooks/common_config.ymldefaults tofcs_auto_download: false, so the default workflow is manual package placement.- If the control node has internet access, set
fcs_auto_download: trueand let dbbot download these archives automatically.
3.3 Configure alarm email
Edit playbooks/common_config.yml:
alert_email_to: 'your_mail@example.com'
alert_email_from: 'your_mail@example.com'
alert_smtp_smarthost: 'smtp.example.com:587'
alert_smtp_auth_username: 'your_mail@example.com'
alert_smtp_auth_password: 'smtp_auth_password'
3.4 Execute deployment
cd /usr/local/dbbot/monitoring_prometheus_ansible/playbooks
ansible-playbook monitoring_prometheus_deployment.yml
4. Deploy exporters
Default value notes:
node_exporter_install_type: dbbotmysqld_exporter_install_type: dbbotmysqld_exporter_topology: auto
This means that the exporter binary that comes with the dbbot repository is used by default and does not rely on GitHub Release download.
4.1 Deploy node_exporter
Edit mysql_ansible/playbooks/vars/var_node_exporter_install.yml, and make sure [dbbot_node_exporter] in inventory/hosts.ini includes only the hosts that should expose host metrics:
cd /usr/local/dbbot/mysql_ansible/playbooks
ansible-playbook node_exporter_install.yml
If you already use another host monitoring tool, you can skip this step entirely.
4.2 Deploy mysqld_exporter
Edit mysql_ansible/playbooks/vars/var_mysqld_exporter_install.yml and execute:
cd /usr/local/dbbot/mysql_ansible/playbooks
ansible-playbook mysqld_exporter_install.yml
Additional instructions:
mysqld_exporter_topology: autois automatically resolved tomsormgron the target host.- If you already know the topology, you can still set it explicitly to
msormgr. - The default value of
mysqld_exporter_porthas been changed toauto. dbbot will automatically derive the exporter port as9104 + (mysql_port - 3306). - Automatically derived example:
mysql_port: 3306->mysqld_exporter_port: 9104mysql_port: 3307->mysqld_exporter_port: 9105mysql_port: 3310->mysqld_exporter_port: 9108
- If you prefer to control the port manually, you can also set it explicitly, for example
mysqld_exporter_port: 9201.
Compatibility note:
- The old
exporter_install.ymlentry still works, but it now maps only tomysqld_exporter_install.ymland no longer deploysnode_exporter.
4.3 dbbot mode
node_exporter_install_type: dbbot
mysqld_exporter_install_type: dbbot
mysqld_exporter_topology: auto
4.4 package mode
node_exporter_install_type: package
node_exporter_package: node_exporter-1.10.2.linux-amd64.tar.gz

mysqld_exporter_install_type: package
mysqld_exporter_package: mysqld_exporter-0.18.0.linux-amd64.tar.gz
mysqld_exporter_topology: auto
Official download examples:
wget "https://github.com/prometheus/node_exporter/releases/download/v1.10.2/node_exporter-1.10.2.linux-amd64.tar.gz"
wget "https://github.com/prometheus/mysqld_exporter/releases/download/v0.18.0/mysqld_exporter-0.18.0.linux-amd64.tar.gz"
package mode notes:
mysql_ansible/playbooks/common_config.ymldefaults tofcs_auto_download_packages: true, so the control node can auto-download the officialnode_exporter/mysqld_exporterpackages.- If you want a fully offline flow, set
fcs_auto_download_packages: false, then place the packages manually undermysql_ansible/downloads/.
5. Register exporter to Prometheus
Prefer dbbotctl exporter register:
dbbotctldirectly reuses the bundledexporterregistrarbinary.- The bundled binary is located at
libexec/dbbotctl/exporterregistrar. - The source directory is
mysql_ansible/exporterregistrar/. - The
exporterregistrarthat comes with the distribution package has been built according toCGO_ENABLED=0,GOOS=linux,GOARCH=amd64,GOAMD64=v1, and is suitable for direct operation on common Red Hat system Linux x86_64 control nodes. - If you have modified the Go code yourself, or the control node is not
Linux amd64, you can entermysql_ansible/exporterregistrar/and re-executesh build.shto generate a new compatibility binary.
# node exporter
dbbotctl exporter register -t node -H 192.0.2.131 -s 192.0.2.161 -p ${prometheus_server_root_password}
dbbotctl exporter register -t node -H 192.0.2.132 -s 192.0.2.161 -p ${prometheus_server_root_password}
dbbotctl exporter register -t node -H 192.0.2.133 -s 192.0.2.161 -p ${prometheus_server_root_password}

# mysqld exporter: MySQL 3307 -> exporter 9105
dbbotctl exporter register -t mysql -H 192.0.2.131 --db-port 3307 -s 192.0.2.161 -p ${prometheus_server_root_password} --topology mgr
dbbotctl exporter register -t mysql -H 192.0.2.132 --db-port 3307 -s 192.0.2.161 -p ${prometheus_server_root_password} --topology mgr
dbbotctl exporter register -t mysql -H 192.0.2.133 --db-port 3307 -s 192.0.2.161 -p ${prometheus_server_root_password} --topology mgr

# mysqld exporter: MySQL 3310 -> exporter 9108
dbbotctl exporter register -t mysql -H 192.0.2.131 --db-port 3310 -s 192.0.2.161 -p ${prometheus_server_root_password} --topology ms
dbbotctl exporter register -t mysql -H 192.0.2.132 --db-port 3310 -s 192.0.2.161 -p ${prometheus_server_root_password} --topology ms
dbbotctl exporter register -t mysql -H 192.0.2.133 --db-port 3310 -s 192.0.2.161 -p ${prometheus_server_root_password} --topology ms
If you explicitly specify a non-automatic port for mysqld_exporter_port, append -P when registering.
If you also want Router metrics in Prometheus, continue with: mysqlrouter_exporter and Router Registration.
6. Validation
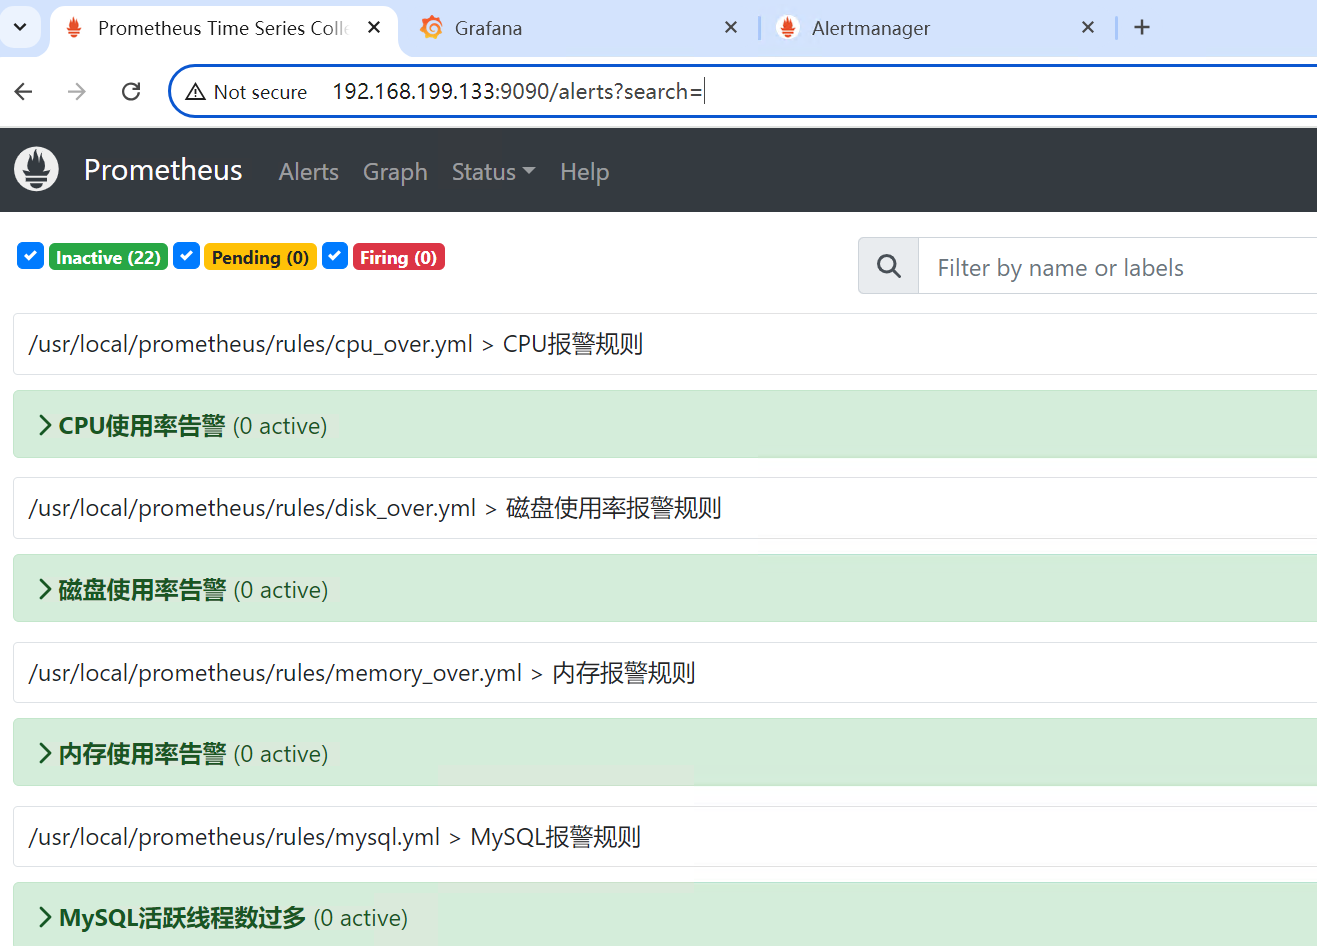
- Prometheus:
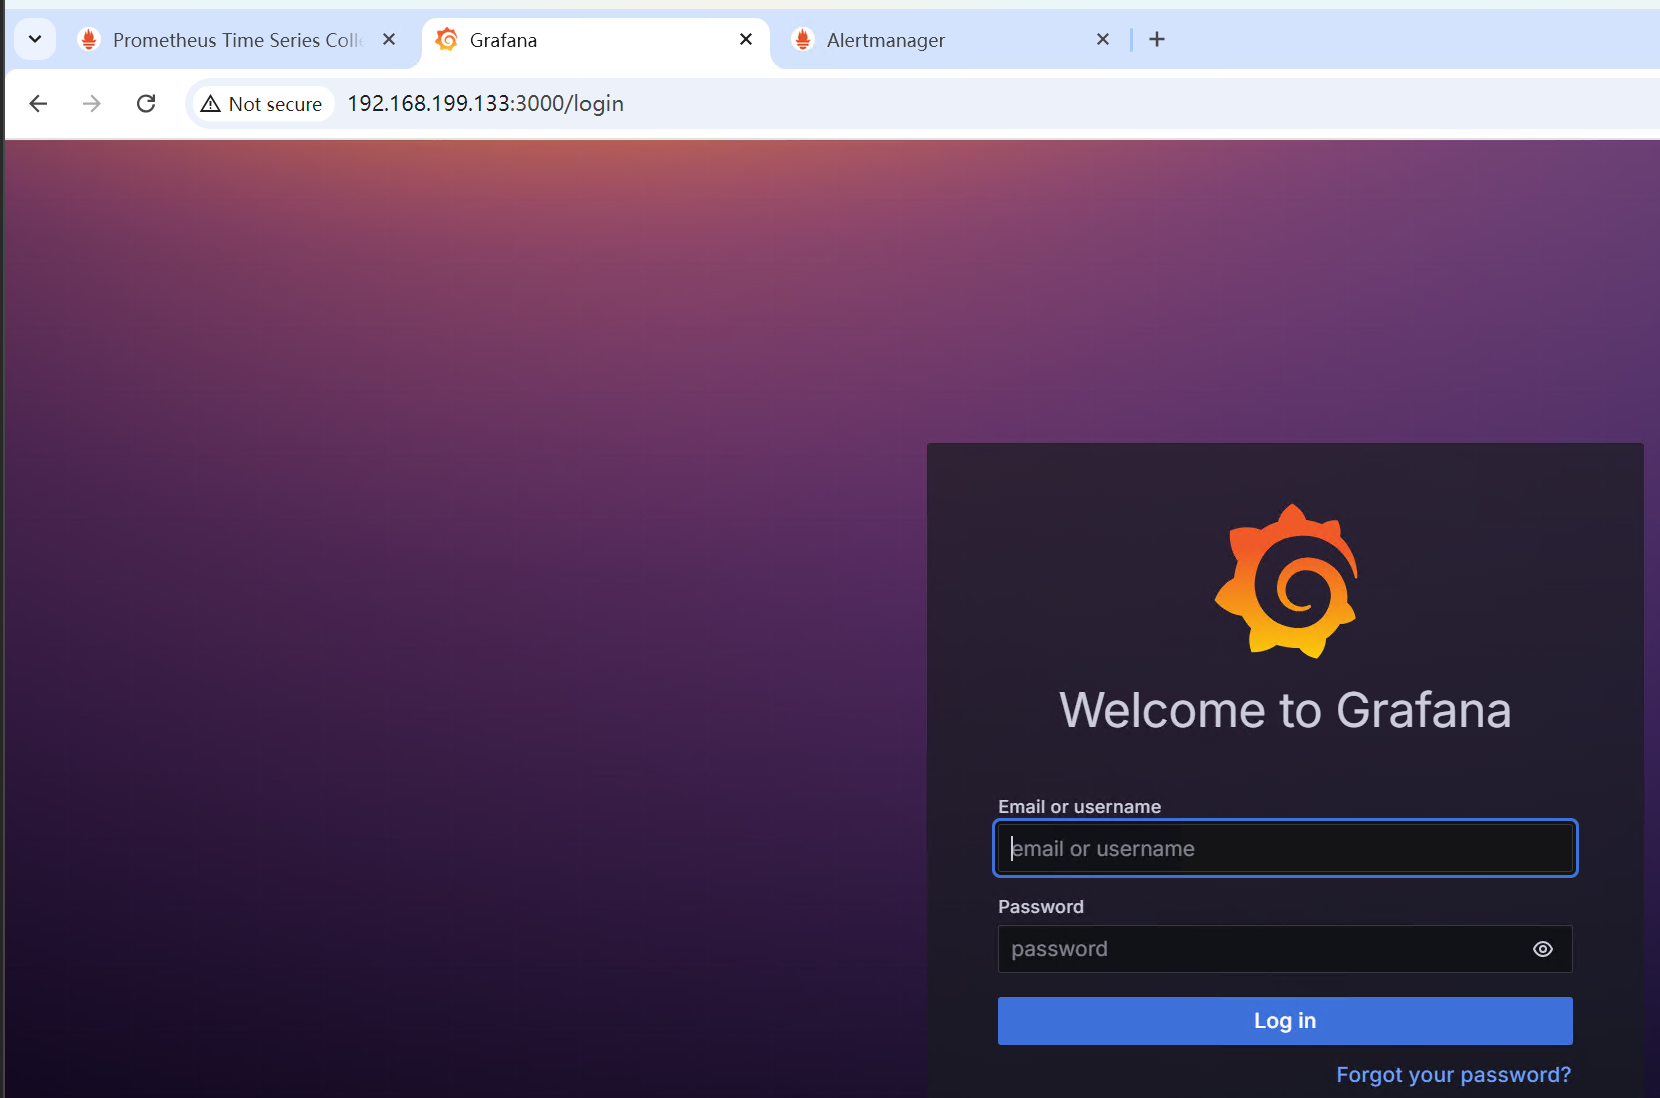
http://192.0.2.161:9090 - Grafana:
http://192.0.2.161:3000 - Alertmanager:
http://192.0.2.161:9093
Grafana default login:
- Username:
admin - Password:
admin
It is recommended to change your password immediately after logging in for the first time.
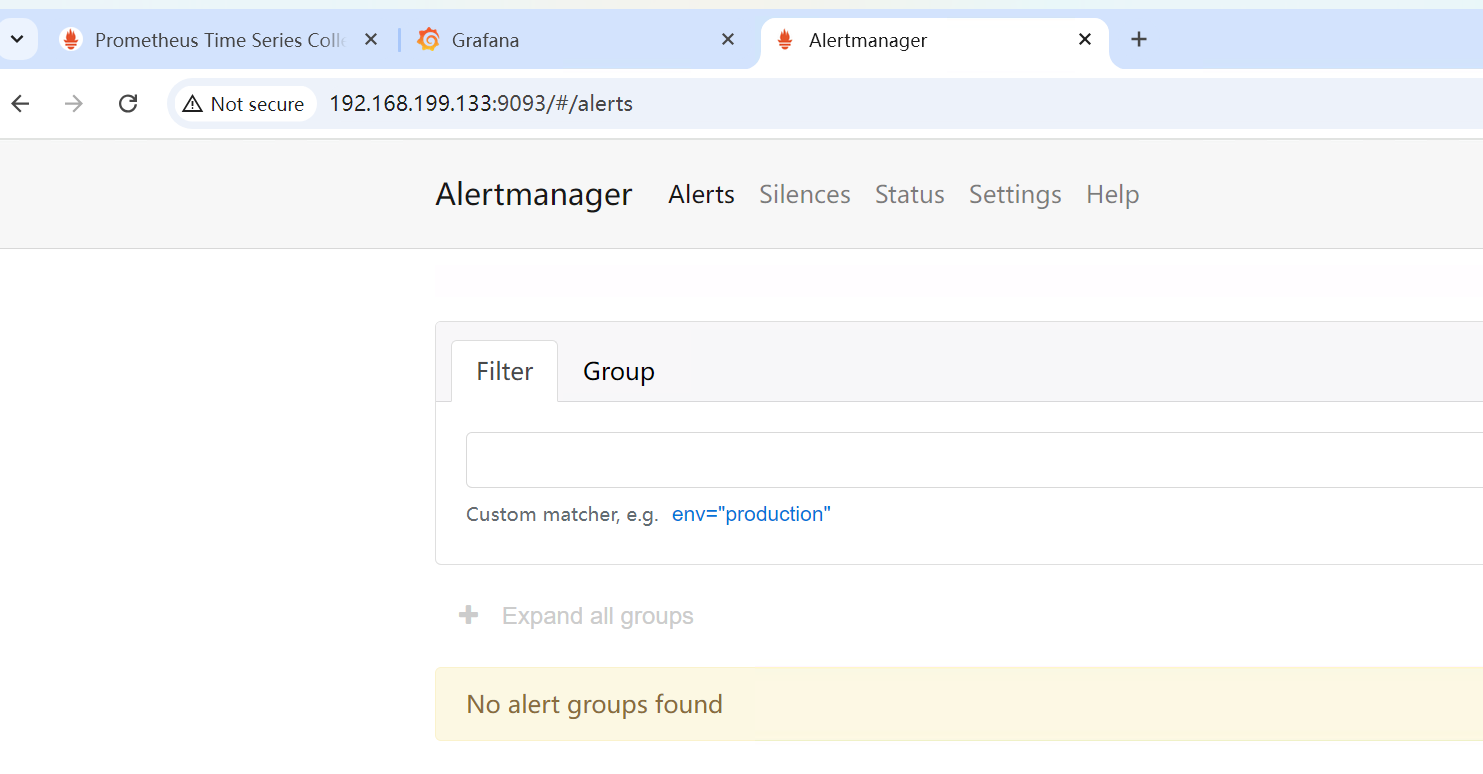
Alert joint debugging suggestion: Execute stop replica; in the replica node and observe the status changes of Prometheus/Grafana/Alertmanager.